So, I created a bad request at aroung 5 am today and one good request now, and I wanted to check how many failed attempts have been made. This might sound naive here but in real time there would be tons of request coming in per day which is supposed to be vizualized using this cool tool.
I am talking about grafana a monitoring tool that lets us vizualize what’s happening inside the datastore connected to it.
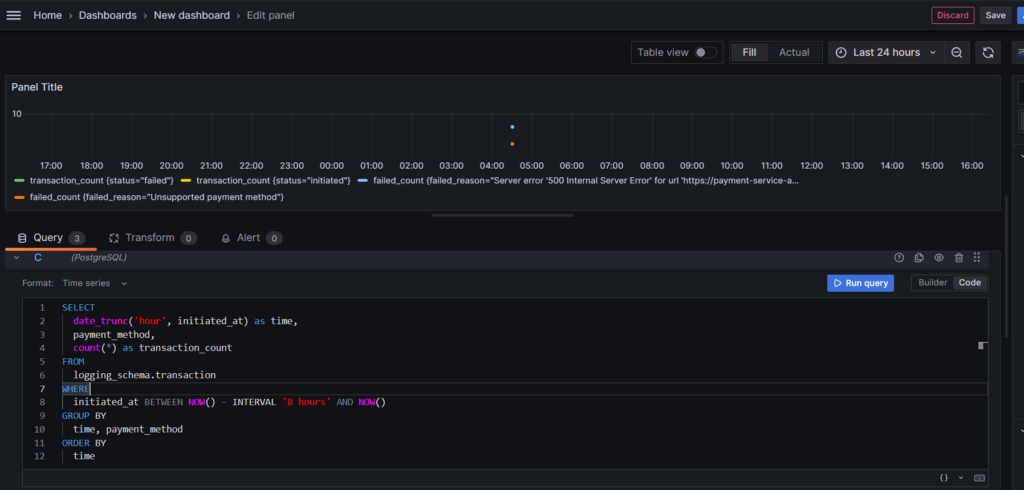
I connect this tool to my database connection and tried to check what are the number of failed attempted happening in a gap of 8 hours.
Here is a snippet of how it looks like.
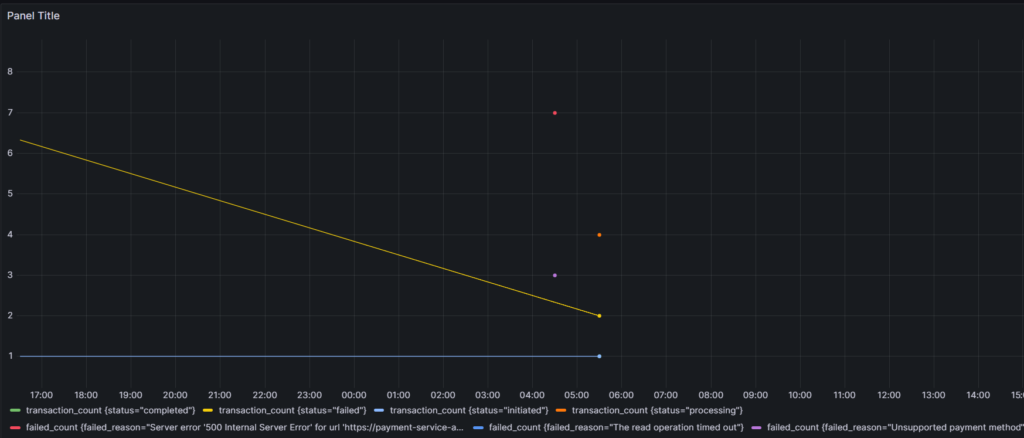
As we can see the yellow color is for failed status and it has decreased over time. This is self explanatory that I mentioned earlier of the kind of requests I made.
The only thing I did here was set up grafana and write some queries to get this done.
I will explain the set up I did for it.
After having gotten the creds I logged in the host page using username and password I was provided.
From the configuration tab, I added a datastore which is postgres in my case fromwhere grafana would pull the data. Used the same password and username to connect along with the port provided at the time of database creation.
The only settings I had to do from the database side is to grant all the privilege to the user using which I connected to grafana.
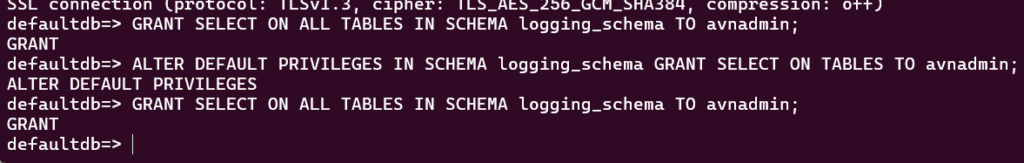
I just logged in to the database using psql command and granted all the access to it.
Did it for two schema from my database since I needed only these two. Total I have five schema, product_schema, user_schema, payment_schema, order_schema and notification_schema. I handled the authentication part in the product and user schema. I forgot to document it though, will do that as I revisit when I will implement concurrent product crud operation in future.
Furthermore, I wrote the query to generate that graph,
At the moment, this is the endlife of the project. Next would be in som different domain rather than ecommerce I m looking forward to think what would be the domain be.