The image you’ve provided contains two visualizations:
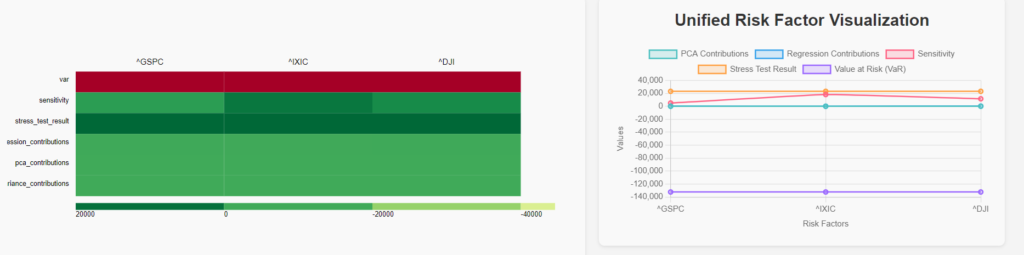
1. Heatmap of Risk Factor Metrics (on the left):
- The heatmap displays various risk metrics for three indices: S&P 500 (^GSPC), NASDAQ (^IXIC), and Dow Jones (^DJI).
- The metrics visualized are:
- VaR (Value at Risk): Indicated by the deep red color, this metric seems to be highly negative across all three indices, with ^GSPC showing the most extreme value.
- Sensitivity: Shows varying levels across the indices, with ^GSPC having a larger sensitivity than ^IXIC and ^DJI.
- Stress Test Result: Displays the impact of an extreme change scenario on the portfolio’s value. This metric is also varied across the indices, with a relatively higher impact on ^GSPC.
- Regression Contributions: These are contributions of each risk factor as determined by regression analysis. The green shades suggest that these contributions are positive across all indices.
- PCA Contributions: Represent the contributions of each principal component to the overall risk. The consistent green color across the indices indicates similar contributions.
- Variance Contributions: Indicates the proportion of variance in the portfolio returns attributed to each risk factor. The green shades suggest a relatively even distribution across the indices.
2. Unified Risk Factor Visualization (on the right):
- This line chart visualizes the different risk metrics (PCA Contributions, Regression Contributions, Sensitivity, Stress Test Result, and VaR) across the three indices.
- VaR (purple line): The Value at Risk is significantly negative across all indices, with the most negative value observed in the S&P 500 (^GSPC), followed by NASDAQ (^IXIC) and Dow Jones (^DJI).
- Sensitivity (pink line): Shows slight variations across the indices, with ^GSPC showing the highest sensitivity, indicating that the portfolio’s value is most sensitive to changes in this index.
- Stress Test Result (orange line): This metric shows some positive values, indicating that the portfolio might gain under certain extreme conditions, but overall, it’s relatively stable across the indices.
- Regression Contributions (blue line) and PCA Contributions (teal line): Both metrics remain relatively stable across all three indices, indicating consistent contributions to the overall risk profile.
Index-wise Analysis:
S&P 500 (^GSPC):
- VaR: The most negative VaR value, indicating a high potential loss in extreme market conditions.
- Sensitivity: Highest among the three indices, suggesting that the portfolio is most reactive to changes in the S&P 500.
- Stress Test Result: Shows a higher impact compared to the other indices, indicating that this index has a significant influence on the portfolio during extreme market conditions.
- Regression and PCA Contributions: Both are consistent with the other indices, showing similar levels of contribution to overall risk.
NASDAQ (^IXIC):
- VaR: Still significantly negative, but less so compared to ^GSPC.
- Sensitivity: Moderate, lower than ^GSPC, indicating a lesser but still considerable impact on the portfolio.
- Stress Test Result: Slightly lower than ^GSPC, but still positive, suggesting some resilience or potential gain in extreme scenarios.
- Regression and PCA Contributions: Stable and consistent, aligning with the contributions seen in ^GSPC and ^DJI.
Dow Jones (^DJI):
- VaR: The least negative among the three, but still indicates a high potential for loss.
- Sensitivity: Lower than both ^GSPC and ^IXIC, suggesting that the portfolio is least reactive to changes in the Dow Jones.
- Stress Test Result: Similar to NASDAQ, with a slightly lower impact, indicating potential resilience.
- Regression and PCA Contributions: Again, consistent with the other indices, showing uniform contribution across the risk factors.
Summary:
- S&P 500 (^GSPC) stands out as the index with the highest risk, showing the most negative VaR and the highest sensitivity. The stress test result indicates that this index could significantly impact the portfolio during extreme conditions.
- NASDAQ (^IXIC) also carries substantial risk but is less extreme compared to the S&P 500. It shows a similar pattern but with lower sensitivity and slightly better stress test results.
- Dow Jones (^DJI) is the least risky of the three, with the lowest negative VaR and sensitivity, indicating that it might have a more stabilizing effect on the portfolio during market fluctuations.
This analysis suggests that the portfolio is heavily influenced by the S&P 500, and to a lesser extent by NASDAQ and Dow Jones, with consistent contributions from regression and PCA across all indices. The significantly negative VaR values across the board, particularly for ^GSPC, suggest that the portfolio is exposed to considerable risk in the current market conditions.