Portfolio management and backtesting are closely linked in the context of financial trading and investment strategies. When you conduct backtesting, you’re typically evaluating how a particular trading strategy or set of strategies would have performed historically. The results of backtesting are often analyzed within the framework of a portfolio, which is a collection of assets (such as stocks, bonds, or other securities) that an investor holds.
Here’s how a portfolio is linked to backtesting:
1. Evaluating Strategy Performance on a Portfolio Level
- Portfolio Backtesting: Instead of testing a strategy on a single asset or symbol, you can backtest it on an entire portfolio of assets. This allows you to assess how the strategy would perform when applied across multiple assets simultaneously.
- Diversification: By backtesting a portfolio, you can evaluate the impact of diversification on risk and returns. A well-diversified portfolio might show reduced volatility and drawdowns compared to a single asset.
- Rebalancing: During portfolio backtesting, you can simulate periodic rebalancing (adjusting the weights of assets) to maintain a desired asset allocation, and evaluate how this affects overall performance.
2. Asset Allocation Strategies
- Static Allocation: Some strategies involve fixed allocations to different assets. Backtesting a portfolio with static allocation helps understand the long-term performance of this allocation strategy.
- Dynamic Allocation: Strategies like mean-variance optimization or risk parity dynamically adjust asset weights based on changing market conditions. Backtesting these portfolios helps evaluate their effectiveness in achieving a balance between risk and return.
3. Risk Management at the Portfolio Level
- Drawdown Analysis: When backtesting a portfolio, you can analyze the maximum drawdown (peak-to-trough decline) across the entire portfolio, which provides insights into potential risks.
- Volatility and Correlation: Portfolio backtesting allows you to measure the overall volatility and the correlation between assets, helping to assess the risk of the portfolio as a whole.
- Value-at-Risk (VaR): Backtesting can help estimate the VaR of a portfolio, which measures the potential loss over a specific period with a given confidence level.
4. Performance Metrics on a Portfolio Basis
- Sharpe Ratio: This measures the risk-adjusted return of the portfolio, helping to assess whether the returns are sufficient to compensate for the risk taken.
- Sortino Ratio: A variation of the Sharpe Ratio that considers only downside volatility, providing a more nuanced view of risk relative to negative returns.
- Alpha and Beta: Backtesting helps calculate portfolio alpha (excess return above the benchmark) and beta (portfolio’s sensitivity to market movements).
5. Simulating Portfolio Strategies
- Strategy Combinations: Backtesting allows you to combine multiple strategies within a portfolio. For example, one part of the portfolio might use a trend-following strategy, while another part uses mean reversion.
- Stress Testing: By backtesting a portfolio, you can simulate how it would have performed during various market conditions, such as recessions, bull markets, or periods of high volatility.
6. Impact of Transaction Costs
- Costs Aggregation: Backtesting at the portfolio level aggregates the impact of transaction costs across all trades within the portfolio. This gives a more accurate picture of net returns after accounting for expenses like commissions and slippage.
- Rebalancing Costs: Frequent rebalancing incurs transaction costs, and portfolio backtesting can help quantify the impact of these costs on overall performance.
7. Portfolio Optimization
- Backtesting Optimization Models: Techniques like mean-variance optimization, where portfolios are constructed to maximize return for a given level of risk, rely heavily on backtesting historical data.
- Parameter Tuning: Backtesting helps fine-tune the parameters of portfolio models (e.g., risk tolerance, asset weights) to optimize performance over historical data.
8. Historical Scenario Analysis
- Market Events: Portfolio backtesting allows you to simulate how the portfolio would have performed during significant historical events, such as financial crises or major market corrections, providing insights into how resilient the portfolio might be under similar future conditions.
9. Testing Hypothetical Portfolios
- New Strategies: Before implementing a new investment strategy, you can backtest it on a hypothetical portfolio to evaluate its potential performance.
- Comparative Analysis: You can compare the backtested performance of different portfolio strategies to decide which one might be the most effective based on historical data.
Why we do we need to backtesting on a specific symbol?
Running backtests on symbols (e.g., stock tickers) is a critical step in evaluating the performance and viability of trading strategies. Here’s why backtesting on specific symbols is important:
1. Historical Performance Evaluation
- Proof of Concept: Backtesting allows you to see how a trading strategy would have performed historically using real market data for a particular symbol. This helps to validate the strategy before deploying it in a live market.
- Assessing Robustness: By running backtests on multiple symbols, you can assess whether a strategy is robust across different market conditions or if it only performs well on certain stocks or sectors.
2. Understanding Symbol-Specific Behavior
- Volatility & Liquidity: Different symbols exhibit different levels of volatility and liquidity. Backtesting on a specific symbol allows you to understand how your strategy performs given the unique price movements and trading volumes of that symbol.
- Market Regime Sensitivity: Some symbols might be more sensitive to broader market trends, sector performance, or even company-specific news. Backtesting helps identify how these factors impact your strategy.
3. Risk Management
- Drawdowns: Backtesting helps you understand potential drawdowns and risks associated with trading a particular symbol. This can help in setting appropriate risk management rules (e.g., stop-loss levels, position sizing).
- Tailoring Strategies: Symbols from different sectors or with different characteristics (e.g., high-growth tech stocks vs. stable utilities) might require tailored strategies. Backtesting helps you fine-tune these strategies.
4. Optimization
- Parameter Tuning: Backtesting on specific symbols allows you to optimize strategy parameters (e.g., moving average periods, entry/exit thresholds) to better suit the behavior of those symbols.
- Cross-Validation: By running backtests on various symbols, you can avoid overfitting your strategy to one particular dataset and instead ensure it performs well across different market conditions.
5. Comparative Analysis
- Benchmarking: Backtesting allows you to compare the performance of your strategy against benchmarks like the S&P 500 or other index funds. This comparison helps determine if your strategy is likely to outperform standard investment options.
- Strategy Comparison: You can also compare the performance of different strategies on the same symbol to identify which one has a better risk-reward profile.
6. Preparation for Live Trading
- Execution Feasibility: Backtesting can reveal potential issues related to the execution of trades, such as slippage or the impact of transaction costs on specific symbols.
- Psyche and Comfort: Seeing historical results on a specific symbol can give you confidence in your strategy, reducing emotional bias during live trading.
7. Regulatory and Compliance Considerations
- **Backtesting helps demonstrate the due diligence taken in developing a strategy, which is essential for meeting compliance requirements, especially in regulated environments like hedge funds or managed accounts.
What is a trading strategy?
A trading strategy is a systematic plan designed to achieve profitable returns by making trading decisions based on a set of predefined rules and criteria. These strategies are typically developed by traders, investors, or automated systems, and they guide the buying and selling of financial assets such as stocks, bonds, commodities, currencies, or derivatives.
Key Components of a Trading Strategy
- Market Selection
- Asset Classes: Determine which financial markets or asset classes to trade, such as equities, forex, commodities, or cryptocurrencies.
- Symbols or Instruments: Specific symbols (e.g., AAPL for Apple stock) or instruments (e.g., S&P 500 index futures) that the strategy will focus on.
- Entry Criteria
- Technical Indicators: Conditions based on technical analysis tools like moving averages, RSI, MACD, Bollinger Bands, etc., that signal when to enter a trade.
- Fundamental Analysis: Conditions based on fundamental factors like earnings reports, economic indicators, interest rates, or news events.
- Quantitative Models: Complex mathematical models that generate entry signals based on historical data patterns, statistical arbitrage, or machine learning models.
- Exit Criteria
- Profit Targets: Predetermined levels at which the strategy will close a position to lock in profits.
- Stop-Loss: A predefined price level or condition at which a losing trade will be closed to limit potential losses.
- Trailing Stops: Dynamically adjusting stop-loss levels that move with the price to protect profits as the trade becomes more favorable.
- Risk Management
- Position Sizing: Rules that determine the amount of capital allocated to each trade, often based on risk tolerance or portfolio size.
- Diversification: Strategies that spread risk across different assets or sectors to avoid overexposure to a single position.
- Risk-Reward Ratio: A metric used to compare the potential reward of a trade to the potential risk, helping to ensure that the expected returns justify the risk taken.
- Time Frame
- Trading Horizon: The time frame over which the strategy operates, such as intraday (day trading), short-term (swing trading), or long-term (position trading).
- Holding Period: The duration for which a position is expected to be held before it meets the exit criteria.
- Execution Plan
- Order Types: The types of orders used (e.g., market orders, limit orders, stop orders) and how they are placed in the market.
- Execution Timing: Strategies may include specific rules for when to execute trades, such as during high liquidity periods or in response to market events.
- Performance Metrics
- Backtesting Results: Historical performance analysis to see how the strategy would have performed using past market data.
- Live Performance: Monitoring of the strategy’s performance in real trading to ensure it meets the expected outcomes.
- Key Metrics: Metrics like Sharpe ratio, drawdown, win rate, and total return, which are used to evaluate the effectiveness of the strategy.
Types of Trading Strategies
- Trend Following
- Objective: To capitalize on long-term movements in the market by entering positions in the direction of the prevailing trend.
- Example: Moving Average Crossover Strategy.
- Mean Reversion
- Objective: To profit from the tendency of asset prices to revert to their historical average or mean.
- Example: Bollinger Bands Strategy.
- Arbitrage
- Objective: To exploit price discrepancies between related markets or instruments.
- Example: Statistical Arbitrage between pairs of correlated stocks.
- Momentum
- Objective: To capitalize on existing price momentum by entering trades in the direction of the current market movement.
- Example: Relative Strength Index (RSI) Strategy.
- Scalping
- Objective: To profit from small price changes, typically by executing a large number of trades within a short time frame.
- Example: High-Frequency Trading (HFT) strategies.
- Event-Driven
- Objective: To capitalize on price movements caused by specific events such as earnings announcements, mergers, or macroeconomic news.
- Example: Merger Arbitrage Strategy.
Automated vs. Discretionary Trading Strategies
- Automated Trading Strategies: These are implemented by computer algorithms that automatically execute trades based on the predefined rules without human intervention.
- Discretionary Trading Strategies: These involve human decision-making, where the trader may use a set of guidelines but ultimately makes decisions based on their judgment.
Importance of a Trading Strategy
- Consistency: Provides a structured approach to trading, reducing emotional decision-making.
- Risk Management: Helps in controlling risks by clearly defining how much to risk on each trade and when to exit positions.
- Performance Tracking: Facilitates the evaluation of trading performance through consistent application and analysis of results.
- Adaptability: Allows traders to refine and improve their approach over time as market conditions change.
In summary, a trading strategy is a critical tool for achieving success in financial markets, enabling traders and investors to navigate market complexities with a disciplined and systematic approach.
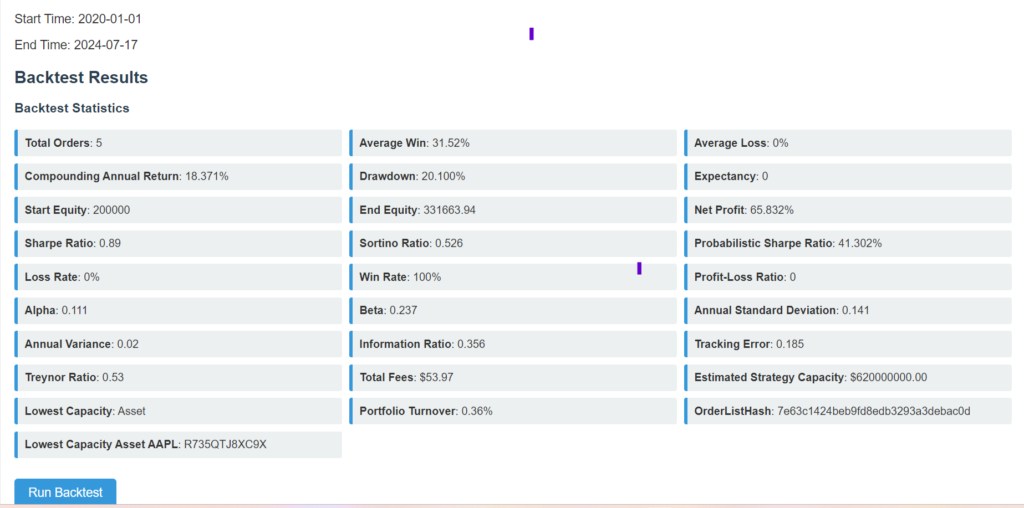
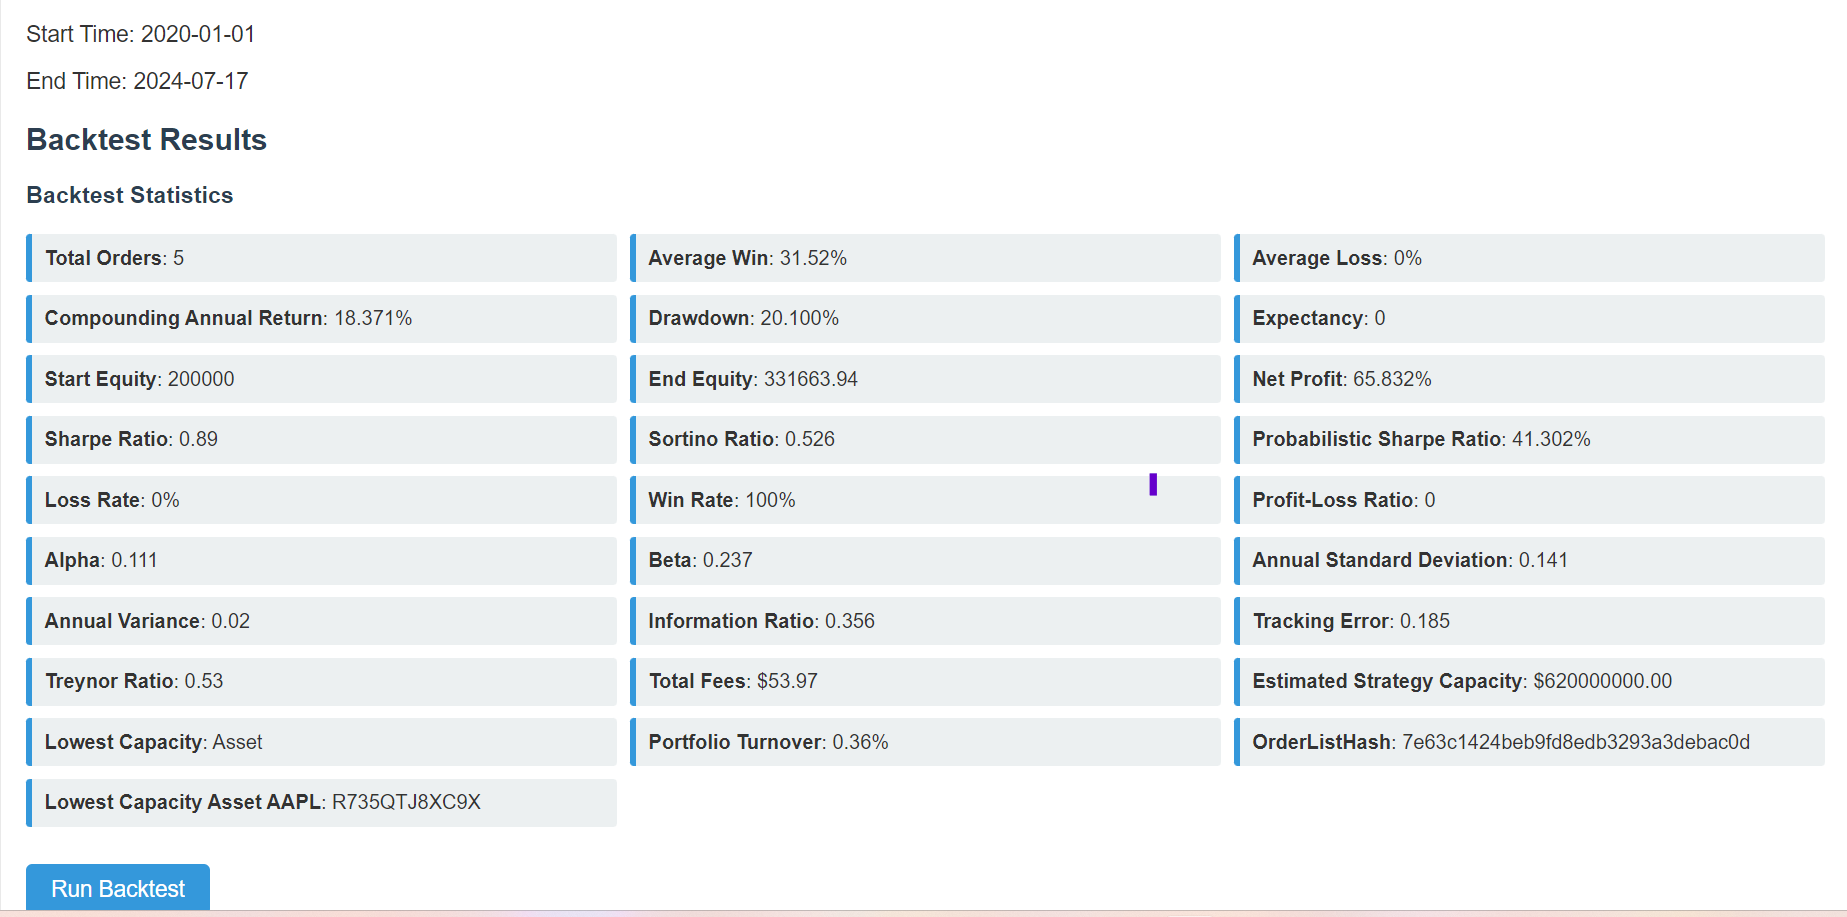
The results of your backtest are summarized in various performance metrics, which provide insights into how the trading strategy would have performed over the specified period (from January 1, 2020, to July 17, 2024). Here’s an explanation of the key metrics:
Performance Metrics
- Total Orders: 5
- This indicates the total number of trades executed during the backtesting period.
- Compounding Annual Return: 18.371%
- The annualized return of the portfolio assuming reinvestment of profits, compounded over the entire period. An 18.371% return suggests a strong performance.
- Start Equity: 200000
- The initial amount of capital at the beginning of the backtesting period, which was $200,000.
- End Equity: 331663.94
- The total value of the portfolio at the end of the backtesting period, which grew to $331,663.94.
- Sharpe Ratio: 0.89
- This measures the risk-adjusted return of the portfolio. A Sharpe ratio of 0.89 indicates that the portfolio has performed well relative to its risk, but there might be room for improvement.
- Sortino Ratio: 0.526
- Similar to the Sharpe ratio, but it only considers downside volatility. A Sortino ratio of 0.526 indicates moderate risk-adjusted returns, focusing only on negative returns.
- Loss Rate: 0%
- Indicates that there were no losing trades during the backtesting period, which is a very positive outcome.
- Win Rate: 100%
- This means that all trades were profitable, contributing to a perfect win rate.
- Average Win: 31.52%
- The average percentage gain on winning trades was 31.52%, which is quite significant.
- Average Loss: 0%
- Since there were no losing trades, the average loss is 0%.
- Drawdown: 20.100%
- The maximum peak-to-trough decline in the portfolio value during the backtest period. A drawdown of 20.1% indicates a significant temporary loss, suggesting some risk exposure.
- Net Profit: 65.832%
- The overall percentage gain from the start to the end of the backtest period. A 65.832% net profit is a strong outcome.
- Alpha: 0.111
- Alpha represents the excess return of the portfolio relative to a benchmark (often a market index). A positive alpha of 0.111 suggests the strategy outperformed the market.
- Beta: 0.237
- Beta measures the portfolio’s sensitivity to market movements. A beta of 0.237 indicates low volatility compared to the market.
- Treynor Ratio: 0.53
- Similar to the Sharpe ratio but uses beta as the risk measure. A Treynor ratio of 0.53 suggests moderate risk-adjusted returns considering market risk.
- Information Ratio: 0.356
- This ratio measures the portfolio’s ability to generate excess returns relative to a benchmark. A positive value indicates that the strategy outperformed the benchmark.
- Probabilistic Sharpe Ratio: 41.302%
- This metric accounts for the probability that the Sharpe ratio is statistically significant. A 41.302% indicates a moderate confidence level in the Sharpe ratio’s significance.
- Profit-Loss Ratio: 0
- Since there were no losses, the profit-loss ratio is 0.
- Annual Standard Deviation: 0.141
- This measures the volatility of the portfolio’s returns. A standard deviation of 0.141 suggests moderate volatility.
- Annual Variance: 0.02
- This is the squared annual standard deviation, representing the variability of returns over time.
- Tracking Error: 0.185
- This measures the deviation of the portfolio’s returns from the benchmark. A tracking error of 0.185 indicates low to moderate deviation.
- Total Fees: $53.97
- The total cost incurred from transaction fees during the backtesting period. Low fees are generally positive for net returns.
- Portfolio Turnover: 0.36%
- The portfolio turnover rate, indicating how frequently the assets were traded. A low turnover rate (0.36%) suggests a long-term strategy with infrequent trading.
- Estimated Strategy Capacity: $620,000,000.00
- An estimate of the maximum capital that can be managed by this strategy before its performance is likely to degrade. $620 million suggests the strategy can handle significant capital.
Summary
Overall, the backtest results indicate a strong performance with a high win rate, no losses, and substantial net profit. The strategy seems well-suited for long-term gains, with low transaction fees and moderate risk as indicated by the drawdown, Sharpe ratio, and beta. However, the moderate Sortino ratio and the drawdown suggest that while profitable, the strategy did experience some periods of risk, which is important to consider depending on your risk tolerance and investment goals.