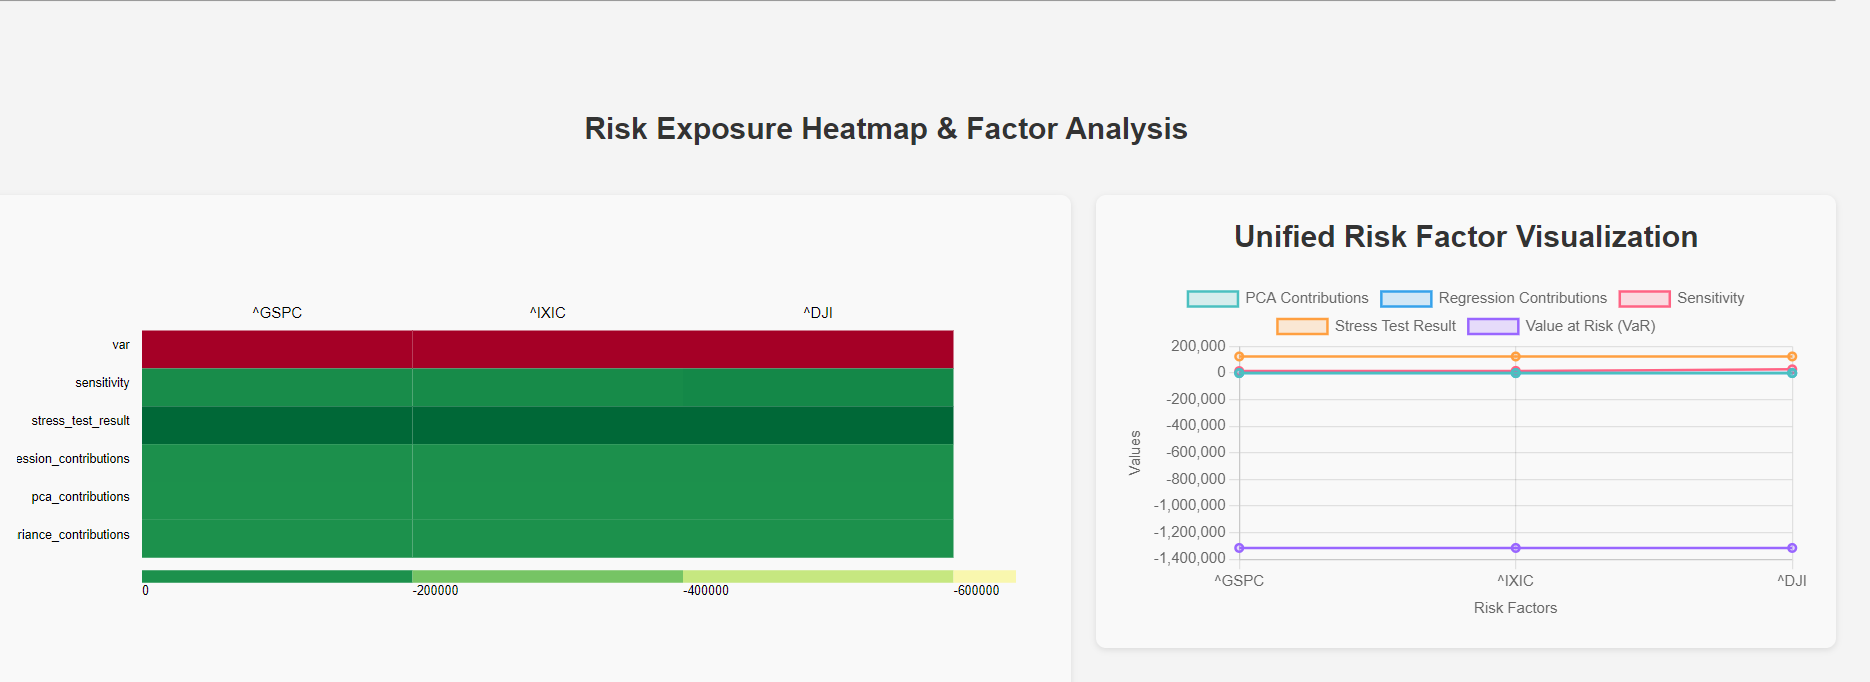
From the heatmap you provided, we can make the following detailed observations:
The code provided simulates how these indices might impact a portfolio by calculating various metrics (e.g., VaR, sensitivity, stress tests) to understand and quantify the risk.
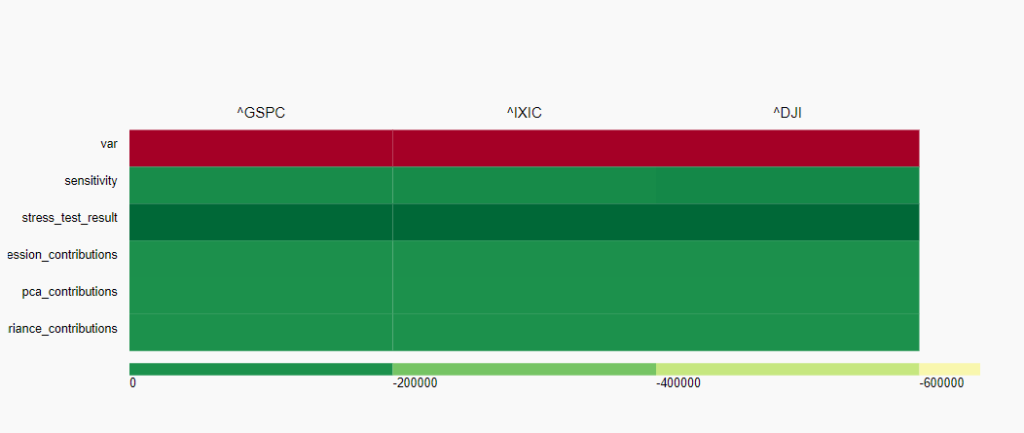
1. Risk Factors and Metrics:
- The heatmap displays the impact of three risk factors (
^GSPC,^IXIC, and^DJI) on six different portfolio metrics (var,sensitivity,stress_test_result,regression_contributions,pca_contributions, andvariance_contributions).
2. Var (Value at Risk):
- The
varrow shows a strong negative impact across all three risk factors, with deep red colors indicating significant losses. This suggests that these risk factors contribute heavily to the portfolio’s risk.
3. Sensitivity:
- The sensitivity row appears to have a moderate green color across all risk factors, indicating a moderate impact on the portfolio’s sensitivity to these risk factors.
4. Stress Test Result:
- The
stress_test_resultrow shows a darker green color, indicating a stronger negative impact on the portfolio when these risk factors experience extreme changes. The risk factor^IXICappears to have a slightly higher impact compared to the others.
5. Regression Contributions:
- The text in this row appears to be cut off, but the color suggests a consistent moderate to low impact across all risk factors.
6. PCA Contributions:
- The
pca_contributionsrow has a consistent green color, indicating a moderate impact from these risk factors on the portfolio when looking at Principal Component Analysis.
7. Variance Contributions:
- The
variance_contributionsrow shows a similar green color, suggesting a consistent, moderate contribution from these risk factors to the portfolio’s overall variance.
8. Color Legend:
- The legend at the bottom indicates that the color scale ranges from strong negative impacts (dark red) to weaker impacts (lighter green to yellow). The values range from
0to approximately-600,000, which shows the magnitude of the impacts.
9. Overall Impact:
- The risk factor
^GSPCseems to have a consistently strong negative impact across most metrics, particularly invarandstress_test_result. - The
^IXICand^DJIrisk factors also show strong negative impacts, particularly invarandstress_test_result, but^IXICseems to have a slightly stronger impact overall compared to^DJI.
Recommendations:
- Var: This metric is particularly sensitive to all three risk factors, indicating that the portfolio is at significant risk if these factors experience adverse changes.
- Stress Test: The portfolio appears vulnerable to stress scenarios, particularly related to
^IXIC. - Optimization: The green colors in the sensitivity and other contribution metrics suggest that there might be room for optimizing the portfolio to reduce its exposure to these risk factors, particularly in terms of the
var.
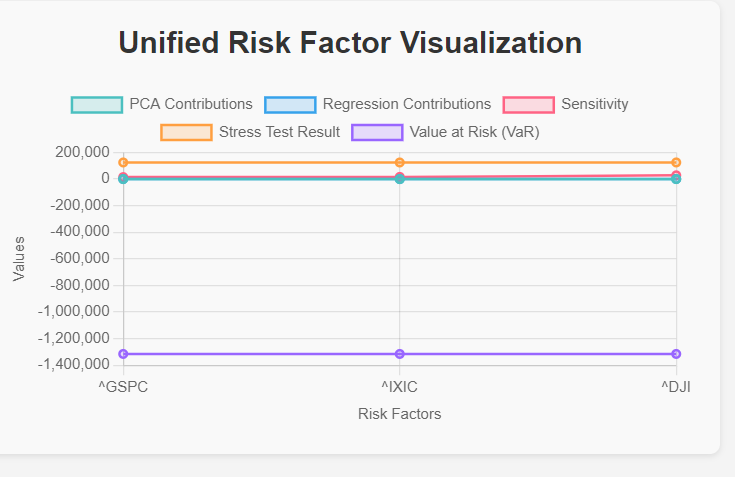
This line chart titled “Unified Risk Factor Visualization” provides a comparative overview of the impact of various risk factors (^GSPC, ^IXIC, and ^DJI) on different portfolio metrics. The chart includes five distinct metrics, each represented by a different colored line:
1. Metrics Represented:
- PCA Contributions (Aqua):
- Represented by an aqua-colored line.
- This metric remains relatively flat across all three risk factors, indicating a minimal contribution from Principal Component Analysis (PCA) across these risk factors.
- Regression Contributions (Blue):
- Represented by a blue line.
- The regression contributions are also quite flat, suggesting that the regression analysis does not attribute significant variation to any of the risk factors in this context.
- Sensitivity (Pink):
- Represented by a pink line.
- Sensitivity metrics show a higher, but still relatively stable, value across all risk factors, indicating a moderate and consistent sensitivity of the portfolio to these factors.
- Stress Test Result (Orange):
- Represented by an orange line.
- The stress test results are quite stable and moderately high across all three risk factors, implying that the portfolio’s performance under stress conditions does not vary significantly between these factors.
- Value at Risk (VaR) (Purple):
- Represented by a purple line.
- The VaR is notably lower than the other metrics, with values in the negative range, indicating that the potential loss due to these risk factors is substantial and consistent across all three factors.
2. Observations on Risk Factors:
- Risk Factor
^GSPC:- Shows moderate impact across all metrics except for VaR, which is significantly negative. This indicates that while the portfolio has moderate sensitivity, regression contributions, and stress test resilience to
^GSPC, it has a high potential loss.
- Shows moderate impact across all metrics except for VaR, which is significantly negative. This indicates that while the portfolio has moderate sensitivity, regression contributions, and stress test resilience to
- Risk Factor
^IXIC:- Exhibits a similar pattern to
^GSPC, with relatively stable metrics across the board, but with a notably large negative VaR, suggesting potential losses.
- Exhibits a similar pattern to
- Risk Factor
^DJI:- This factor also follows the same pattern, with consistent metrics and a significant negative VaR, suggesting that these risk factors behave similarly in influencing the portfolio.
3. Scale and Distribution:
- The Y-axis scale is quite broad, ranging from about -1,400,000 to +200,000, which helps to emphasize the differences in VaR while showing that other metrics are relatively clustered around the 0 to 200,000 range.
- This distribution indicates that the main risk to the portfolio comes from potential losses (VaR), while the other metrics suggest stability or moderate impact.
4. Insights and Implications:
- High Negative VaR: The most striking observation is the high negative Value at Risk (VaR) across all three risk factors, implying that the portfolio is potentially exposed to significant losses due to these factors.
- Stable Other Metrics: The relatively stable lines for PCA Contributions, Regression Contributions, Sensitivity, and Stress Test Results imply that the portfolio’s performance does not drastically change across these risk factors in these areas.
- Focus Areas: Risk management strategies should particularly focus on mitigating potential losses as indicated by the VaR, while the other metrics suggest that the portfolio is relatively balanced in terms of sensitivity and stress resilience.
Recommendations:
- Risk Mitigation: The focus should be on reducing exposure to potential losses as indicated by the VaR, possibly through hedging strategies or diversification.
- Further Analysis: Consider deeper analysis into why VaR is so negative and explore ways to optimize the portfolio to reduce this risk.
- Regular Monitoring: Continuously monitor these metrics, particularly VaR, as they provide crucial insights into the portfolio’s vulnerability to these key market indices.