Here are the index-wise observations based on the visualizations provided:
1. Index: ^GSPC (S&P 500)
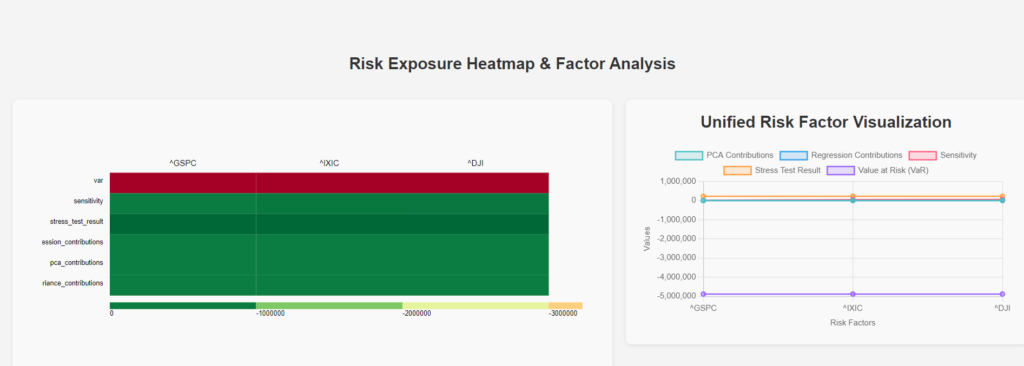
- VaR (Value at Risk):
- The
VaRfor^GSPCis significantly negative, indicated by a deep red color in the heatmap. This suggests that the portfolio is highly exposed to potential losses due to movements in the S&P 500. - In the line chart, the
VaRvalue drops sharply, confirming the high potential for loss associated with this index.
- The
- Sensitivity:
- The sensitivity metric for
^GSPCshows a moderate negative impact (dark green color in the heatmap). This indicates that the portfolio is sensitive to changes in the S&P 500, though not as severely as it is toVaR. - The sensitivity line is relatively flat and stable in the line chart, implying consistent exposure.
- The sensitivity metric for
- Stress Test Result:
- The stress test result for
^GSPCis moderately negative, indicating that the portfolio could experience notable losses under adverse market conditions related to this index. - The heatmap shows this with a green color, and the line chart reflects a stable but significant impact.
- The stress test result for
- Regression Contributions:
- The regression contributions for
^GSPCare moderate, suggesting that changes in this index explain a reasonable amount of the portfolio’s returns. - The consistent green color in the heatmap indicates this impact, which is flat in the line chart.
- The regression contributions for
- PCA Contributions:
- The PCA contributions for
^GSPCare minimal, indicating that this index does not significantly drive the portfolio’s overall variance when considering principal components. - This is shown by a flat line in the line chart and a consistent green color in the heatmap.
- The PCA contributions for
- Variance Contributions:
- The variance contributions from
^GSPCare moderate, indicating that this index contributes to the overall variance in the portfolio, but not excessively. - The impact is consistent across all risk factors, as seen in the heatmap and the flat line in the line chart.
- The variance contributions from
2. Index: ^IXIC (NASDAQ)
- VaR (Value at Risk):
- Similar to
^GSPC, theVaRfor^IXICis significantly negative, shown by the deep red color in the heatmap and a sharp drop in the line chart. This suggests high exposure to potential losses from movements in the NASDAQ index.
- Similar to
- Sensitivity:
- The sensitivity metric for
^IXICshows a moderate impact, similar to^GSPC, indicated by the dark green color in the heatmap. The line chart confirms this with a stable, moderate level of sensitivity.
- The sensitivity metric for
- Stress Test Result:
- The stress test result for
^IXICindicates that the portfolio could experience moderate losses under stress scenarios related to the NASDAQ index. - The green color in the heatmap and the consistent line in the chart confirm this.
- The stress test result for
- Regression Contributions:
- The regression contributions for
^IXICare moderate, suggesting that changes in the NASDAQ index explain some of the portfolio’s returns. - This is reflected in the green color in the heatmap and the flat line in the line chart.
- The regression contributions for
- PCA Contributions:
- The PCA contributions for
^IXICare minimal, indicating that this index does not significantly contribute to the overall variance in the portfolio based on principal components. - This is shown by the flat line in the line chart and consistent green color in the heatmap.
- The PCA contributions for
- Variance Contributions:
- The variance contributions from
^IXICare moderate, indicating that this index contributes to the overall portfolio variance but not excessively. - The impact is consistent with the other indices, as seen in the heatmap and line chart.
- The variance contributions from
3. Index: ^DJI (Dow Jones Industrial Average)
- VaR (Value at Risk):
- The
VaRfor^DJIis also significantly negative, indicating a high potential for losses due to movements in the Dow Jones Industrial Average. The heatmap shows a deep red color, and the line chart confirms the sharp drop in VaR.
- The
- Sensitivity:
- The sensitivity metric for
^DJIshows a moderate negative impact, similar to^GSPCand^IXIC. This is indicated by the dark green color in the heatmap and the stable line in the chart.
- The sensitivity metric for
- Stress Test Result:
- The stress test result for
^DJIindicates moderate losses under stress conditions related to this index. - The green color in the heatmap and the consistent line in the line chart reflect this impact.
- The stress test result for
- Regression Contributions:
- The regression contributions for
^DJIare moderate, suggesting that changes in this index explain a portion of the portfolio’s returns. - This is indicated by the green color in the heatmap and the flat line in the line chart.
- The regression contributions for
- PCA Contributions:
- The PCA contributions for
^DJIare minimal, indicating that this index does not significantly drive the portfolio’s overall variance when considering principal components. - The impact is reflected in the flat line in the line chart and the consistent green color in the heatmap.
- The PCA contributions for
- Variance Contributions:
- The variance contributions from
^DJIare moderate, indicating that this index contributes to the overall variance in the portfolio but not excessively. - The heatmap and line chart both show a consistent impact similar to the other indices.
- The variance contributions from
Summary of Index-Wise Impact:
- VaR is the Most Critical Metric Across All Indices:
- All three indices (
^GSPC,^IXIC, and^DJI) show significant negative VaR, suggesting that these are the primary drivers of potential losses in the portfolio. This warrants particular attention and risk mitigation strategies.
- All three indices (
- Consistency in Sensitivity and Stress Test Results:
- The portfolio’s sensitivity and stress test results are consistent across all three indices, showing moderate impact. This suggests a balanced exposure across these indices, but also highlights the need to maintain this balance through regular monitoring.
- Minimal Impact from PCA Contributions:
- PCA contributions are minimal across all indices, indicating that these factors do not significantly affect the portfolio’s overall variance when considering principal components.
- Moderate Variance and Regression Contributions:
- Variance and regression contributions are moderate and consistent across all indices, indicating that each index plays a role in explaining the portfolio’s returns and variance, but none is overly dominant.